Will Australian interest rates ever go up?
While the global economy is seeing its fastest growth in years and the US Federal Reserve has increased rates five times since December 2015 and is on track for more hikes this year, the Reserve Bank of Australia (RBA) has now left interest rates on hold for a record 21 months in a row. The Australian economy is in a very different position to the US. While the RBA continues to expect that the next move in rates is most likely to be up, and we tend to agree, we now don’t see a hike until sometime in 2020. And the next move being a cut cannot be ruled out. This note looks at the reasons and what it means for mortgage rates, the $A and investors.

Four reasons why rates will be on hold into 2020
We have been looking for a rate hike in early 2019, but have now pushed that out to 2020 for the following reasons:
-
First, growth is likely to remain below RBA expectations. A bunch of factors will help keep the economy growing: the drag on growth from falling mining investment is largely over; non-mining investment is rising; infrastructure investment is booming; and net exports should add to growth helped by strong global conditions. However, against this housing construction is slowing and consumer spending is constrained with downside risks around slow wages growth, high debt levels and falling house prices in Sydney and Melbourne. Personal tax cuts likely to be tabled in the Budget will help keep the consumer going but are unlikely to offset all the drags. So while growth will likely improve from the 2.4% pace seen last year, it is likely to be to between 2.5% and 3%, below RBA expectations for a pick up to 3.25%.
-
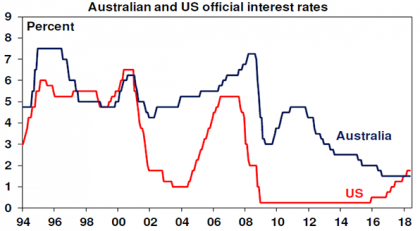
Second, wages growth and inflation are likely to remain low as growth is unlikely to be strong enough to eat into significant spare capacity in the Australian economy. Some say Australian rates just follow those in the US but there has been a big divergence in recent years. In 2009 while the Fed left rates near zero the RBA started raising rates only to start cutting them from 2011. And while the Fed started hiking rates in 2015 we continued cutting them in 2016.
Source: Bloomberg, AMP Capital
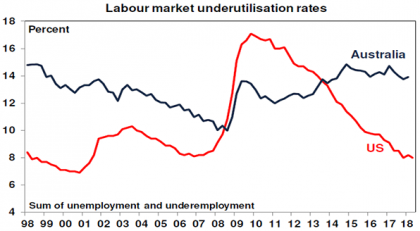
There is good reason for the RBA to lag the Fed. Labour market underutilisation (see next chart) at 8% in the US is about as low as it ever gets whereas in Australia its around 14%. If wages growth is only just starting to pick up in the US despite a much tighter labour market it’s no surprise that it will take much longer in Australia.
Source: Bloomberg, AMP Capital
Continuing weak wages growth along with excess capacity and high levels of competition in goods markets will keep underlying inflation around the low end of the RBA’s 2-3% target for a lengthy period yet.
-
Third, bank lending standards are going through yet another round of tightening as the household debt boom comes to an end, doing the RBA’s work for it. Now it relates to policies and practices around borrowers’ income, expenses and total debt levels. This has been driven by APRA which is shifting away from blunter constraints on lending to certain categories of borrowers (such as the 10% speed limit on credit growth to property investors) and is receiving added impetus now. This will particularly hit lower income borrowers and high home price to income markets like Sydney and Melbourne. Tougher checking of income and expenses and constraints in terms of the amount of loans going to high total debt to income borrowers will likely lead to a slowing in credit growth in the months ahead. While a credit crunch is unlikely its hard to reliably predict the impact of tighter lending standards.
-
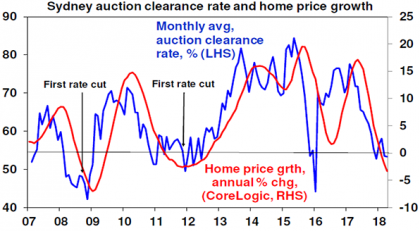
Finally, house prices are slowing led by falling prices in Sydney and Melbourne with more weakness likely. APRA measures to constrain investor and interest only borrowers have worked. These measures, combined with poor affordability, rising unit supply, falling expectations for price growth and the end of FOMO (fear of missing out) are pushing prices down. The latest round of tighter lending standards will add to this, as will any move to lower immigration levels (and curtail negative gearing and the capital gains tax discount were there to be change in government).
Source: Domain, AMP Capital
Capital cities other than Sydney and Melbourne face a much better outlook as they did not see the same boom in recent years. However, we see prices in Sydney and Melbourne falling another 5% this year, another 5% next year and with further slight falls in 2020. We are running around levels for price growth and auction clearance rates that in the past have been associated with the start of interest rate cutting cycles (in September 2008 and November 2011 – see the previous chart), not rate hikes! The risks of a sharper fall in prices if investors lose faith, homeowners decide to reduce high debt levels and if the shift from interest only to principle and interest for many borrowers over the next few years creates problems needs to be allowed for. Raising rates when prices are falling will accentuate these risks.
As a result of these considerations, we have pushed our timing regarding the start of interest rate increases into 2020. Of course, the risk here is that by 2020 the US economy may be weakening making it hard for the RBA to then start considering rate hikes. And of course, if the declines in home prices turn out to be deeper the next move could end up being a cut.
Won’t mortgage rates rise anyway?
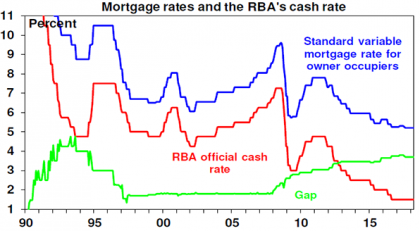
Since the time of the GFC “out of cycle” changes in bank mortgage rates have been common. However, the main driver of significant changes in mortgage rates remains what the RBA does with the cash rate – see the next chart. It cut from 2008 and mortgage rates fell. It hiked from October 2009 and mortgage rates rose. It cut from November 2011 and so mortgage rates fell. This makes sense as the banks get around 65% of their funding from bank deposits the main driver of which is the cash rate. However, the remaining 35% can cause some variation as will regulatory changes which saw higher rates for investors and interest only borrowers recently.
Source: RBA, AMP Capital
There are two main pressures at present. The first is a rise in money market funding costs in the US and Australia of around 0.3 to 0.4%. Given that only 10-15% of bank funding comes from this source its unlikely to have much impact. And the banks are unlikely to pass on the extra costs to owner occupiers on traditional loans given the Royal Commission, but banks could raise rates for investors and interest only borrowers. Higher US bond yields could also place some pressure on bank funding costs but again this is likely to be modest, and probably unlikely to result in higher rates for owner occupiers on traditional loans. The main thing for traditional borrowers to watch is the cash rate. If we are right, such borrowers will see pretty stable mortgage rates out to 2020.
What about the $A?
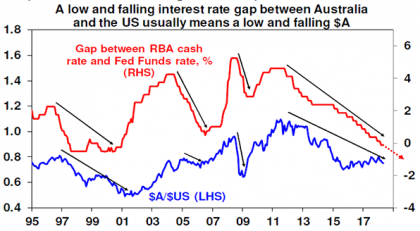
With the RBA likely on hold and the Fed set to keep hiking the interest rate gap between Australia and the US will go further into negative territory. Historically, this means a fall in the value of the Australian dollar. The $A appears to be starting to break below the rising trend channel that’s been in place since 2015 and we see more downside to around $US0.70. A fall to below $US0.50 as we saw in 2001 is unlikely as commodity prices are likely to remain much stronger than they were then.
Source: Bloomberg, AMP Capital
Implications for investors
First, bank deposits are likely to continue providing poor returns for investors for a while yet.
Second, as a result assets that are well diversified and provide decent income flow remain worthy of consideration. This includes unlisted commercial property and infrastructure along with Australian shares which continue to offer much higher income yields compared to bank deposits.
Third, Australian bonds are likely to outperform global bonds which are dominated by the US as US bond yields rise (on the back of Fed tightening) relative to Australian yields (which will be constrained by on hold RBA cash rates).
Finally, with the $A likely to fall further there is reason to keep a decent exposure to global assets on an unhedged basis.
Source: AMP Capital 3 May 2018
Important note: While every care has been taken in the preparation of this article, AMP Capital Investors Limited (ABN 59 001 777 591, AFSL 232497) and AMP Capital Funds Management Limited (ABN 15 159 557 721, AFSL 426455) makes no representations or warranties as to the accuracy or completeness of any statement in it including, without limitation, any forecasts. Past performance is not a reliable indicator of future performance. This article has been prepared for the purpose of providing general information, without taking account of any particular investor’s objectives, financial situation or needs. An investor should, before making any investment decisions, consider the appropriateness of the information in this article, and seek professional advice, having regard to the investor’s objectives, financial situation and needs. This article is solely for the use of the party to whom it is provided.

