…it’s not as bad as it looks, but it’s still an issue
Dr Shane Oliver – Head of Investment Strategy and Chief Economist, AMP Capital
Introduction
If Australia has an Achilles’ heel it’s the high level of household debt that has accompanied surging home prices over the last 30 years. Of course, in the absence of a major trigger for debt servicing problems – either from a surge in unemployment or a surge in interest rates – it hasn’t so far caused a major problem for the economy. Fears that the pandemic would deliver a trigger in the form of higher unemployment were quickly headed off by JobKeeper and record low interest rates. But a potential trigger is now upon us again with rising interest rates.

At one extreme some see rising interest rates and high household debt as setting the scene for a perfect storm of a surge in mortgage stress, forced selling and a crash in property prices causing a big hit to the economy. At the other extreme some point out that the household sector is actually in good shape given a surge in wealth including a big rise in bank deposits so there is no need for concern. The truth is probably in between these two extremes. And much depends on how high interest rates go. This note looks at the main issues.
Australia – from the bottom to the top in debt
The next chart shows the level of household debt relative to annual household disposable income for major countries.
Household debt to income ratios
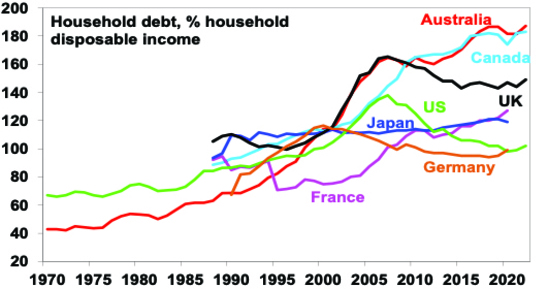
Source: OECD, ABS, RBA, AMP
While rising household debt has been a global phenomenon, debt levels in Australia have gone from the bottom of the pack to near the top. In 1990, there was on average $69 of household debt for every $100 of average household income after tax. Today, its $187 of debt for every $100 of after-tax income.
What’s driven the rise in debt?
The increase in debt reflects four things. First, increased competition amongst lenders following financial deregulation in the 1980s which made debt more available. Second, progressively lower interest rates since the late 1980s have made debt seem more affordable. Third, attitudes to debt have become more relaxed as memories of wars and severe economic downturns have faded so debt seems less risky at the same time that modern society encourages instant gratification as opposed to saving for what you want. So, each successive generation since the Baby Boomers have been progressively more relaxed about taking on debt. And finally, it’s become somewhat self-feeding in that rising debt has enabled home buyers to pay more for homes which in turn has necessitated rising debt levels to get into the property market.
The rise in household debt has gone hand in hand with higher home prices relative to incomes in Australia
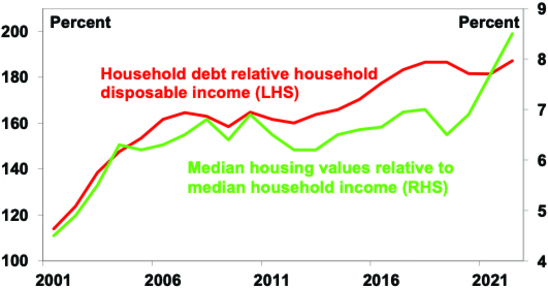
Source: ABS, CoreLogic, AMP
It’s not quite as bad as it looks
There are several reasons why it’s not quite as bad as it looks:
-
First, the rise in debt partly reflected a rational adjustment to lower rates and greater credit availability since the 1980s.
-
Second, household debt has been trending up since credit was invented. It is unclear what a “safe” level is.
-
The rise in debt has been exceeded by a rise in wealth. Thanks to a surge in the value of houses and financial wealth, we are far richer. In particular, thanks to low rates & recovery from the pandemic total household wealth rose 32% over the two years to the March quarter with the value of dwellings up 40%, super up 30% and bank deposits up 26% (as income and government payments were saved during the pandemic). The value of average household wealth has gone from 5 times average after-tax household income in 1990 to 11.4 times in the March quarter.
Aust household wealth and debt relative to income

Source: ABS, RBA, AMP
So, while average household debt for each Australian has risen from $11,779 in 1990 to $107,318 now, average wealth per person has surged from $87,489 to $655,894.
Australian per capita household wealth and debt
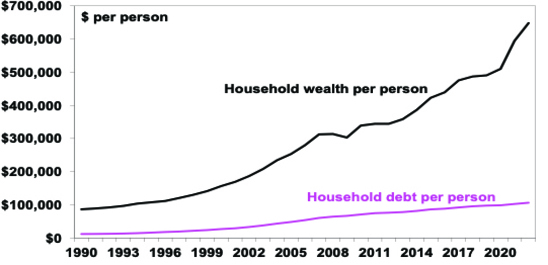
Source: ABS, RBA, AMP
As a result, Australians’ household balance sheets, as measured by net wealth (assets less debt), are healthy. Net wealth relative to income has surged over the last 30 years and is high relative to comparable countries.
Aust household balance sheet in reasonable shape
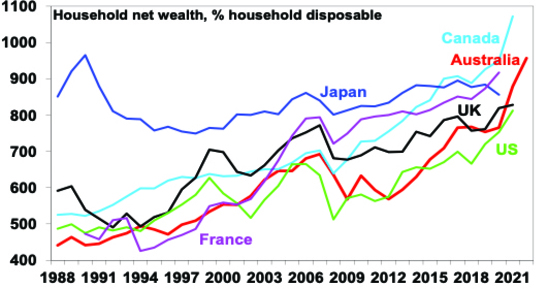
Source: OECD, ABS, RBA, AMP
-
Fourthly, Australians are not having big problems servicing their loans with low non-performing loans. This may reflect record low mortgage rates until recently.
Household interest payments relative to disposable income
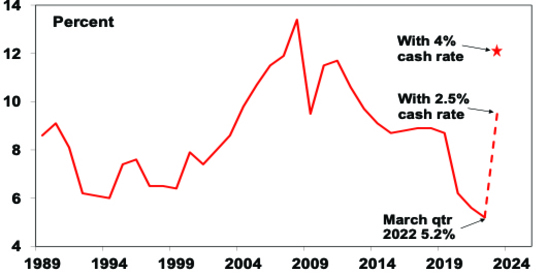
Source: RBA, AMP
-
Fifthly, the dollar value of debt is concentrated in higher income households who have a higher capacity to service it, particularly in relation to investment property loans.
-
Finally, lending standards did not deteriorate to the same degree in Australia as they did in the US prior to the GFC and were tightened from mid last decade with banks having to assess each new borrower’s ability to pay mortgage rates 2.5 percentage points above the borrowing rate up to October last year and 3 percentage points above since then.
But high debt has likely still increased the vulnerability of the household sector
While this analysis indicates that the rise in household debt in Australia is not as bad as it appears, its rise still leaves many households more vulnerable to rising interest rates (& higher unemployment) than in the past. After all, “it’s not what you own that might send you bust but what you owe.”
-
While the rise in wealth is good news it does not mean that there is no reason for concern. Debt has to be serviced out of income as opposed to out of wealth (as a colleague pointed out it’s not possible for a homeowner to sell off a bedroom to make higher interest payments). What’s more the surge in wealth, particularly for dwellings, flowed partly from low interest rates and is now coming under pressure as rates rise. We expect home prices to fall 10-15% which risks driving negative equity for recent low deposit home buyers.
-
The rise in debt means that moves in interest rates are now nearly three times as potent compared to 30 years ago. Just a rise in the cash rate to 2.5% will see a near doubling in debt interest payments as a share of household income (see last chart) and take them to where they were in 2013 (after which economic growth was relatively sluggish in Australia). A rise in the cash rate to around 4% (which is the money market’s expectation for next year) will push interest payments from around 5.2% of income to around 12%.
-
Coming at a time of falling real incomes due to cost-of-living pressures this implies a significant hit to household spending power.
-
While many households have built up cash buffers and are ahead on their mortgage payments and the household saving rate remains high, RBA analysis also indicates there is a significant group who would see a sharp rise in their mortgage payments if mortgage rates rose by 2% and most economists and the market expect more than this.
-
This group is likely to include those who bought into the property market more recently who have had less time to get ahead on their mortgages. While the dollar value of debt is concentrated amongst higher income households, its high amongst 30-40 year olds – ie, recent buyers with young families – and it’s this group who are most likely to be the marginal consumers who will likely have to cut their spending in response to rising interest rates and costs.
-
Rising unemployment should the economy fall into recession would add to debt servicing problems.
-
Poor consumer confidence and accelerating home price declines in Sydney and Melbourne (and other cities seeing a rapid slowing) far earlier in this rate hiking cycle than normal warn of the household sector’s increased vulnerability.
Concluding comment
This all sounds rather gloomy. The key though is that the RBA only needs to raise interest rates far enough to cool demand to take pressure off inflation and keep inflation expectations down. While the household sector in aggregate is stronger than a focus on household debt alone would suggest, the rise in household debt has made monetary policy more potent than it was in the past which in turn will limit how much the RBA will need to raise interest rates by. While the RBA is hiking more aggressively now to reinforce its commitment to the 2-3% inflation target, the greater sensitivity of the household sector to rising interest rates is likely to become evident fairly quickly which will mean the RBA won’t have to raise interest rates as far as the 4% or so cash rate that the money market is assuming. We continue to see the cash rate topping out at around 2.5% in the first half next year.
Source: AMP Capital June 2022
Important note: While every care has been taken in the preparation of this document, AMP Capital Investors Limited (ABN 59 001 777 591, AFSL 232497) and AMP Capital Funds Management Limited (ABN 15 159 557 721, AFSL 426455) make no representations or warranties as to the accuracy or completeness of any statement in it including, without limitation, any forecasts. Past performance is not a reliable indicator of future performance. This document has been prepared for the purpose of providing general information, without taking account of any particular investor’s objectives, financial situation or needs. An investor should, before making any investment decisions, consider the appropriateness of the information in this document, and seek professional advice, having regard to the investor’s objectives, financial situation and needs. This document is solely for the use of the party to whom it is provided.